OK now comes the next program which is
Insight Map Creator (IMC)
This is the program that is going to create the zoomable levels for you and output it in a format for your chart plotter
When you use IMC's "Views" it will give you different options in the "advanced options"
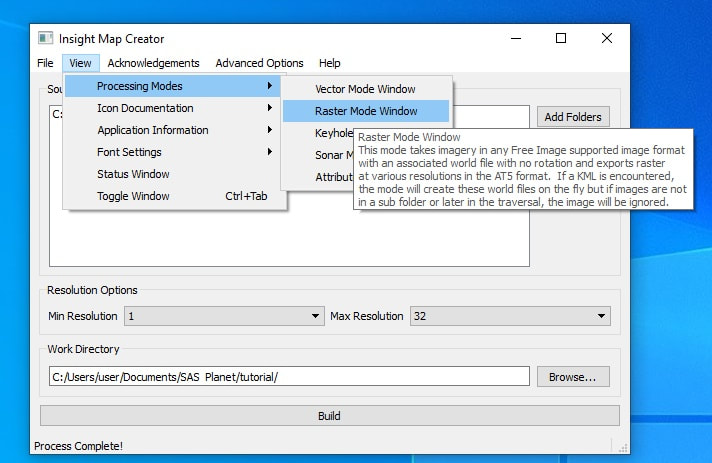
We will use views> processing modes "keyhole & raster" to create our final product.
On the Jpeg & KML we created on previous page we are now going to perform some keyhole surgery
and make another referencing file needed for later rasterization.
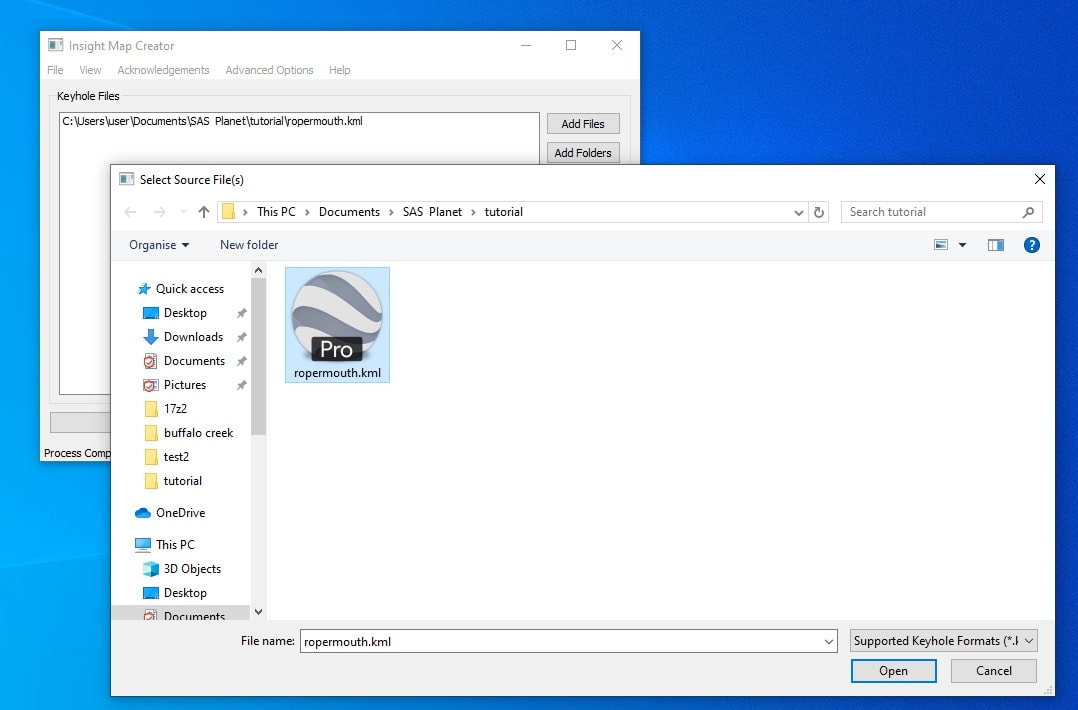
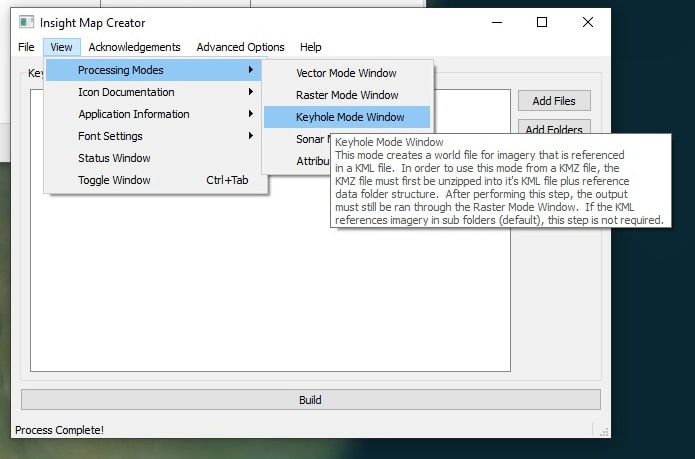
Simple step, get to keyhole mode window via view> processing mode and add the the KML you just created (with SASPlanet) from your folder.
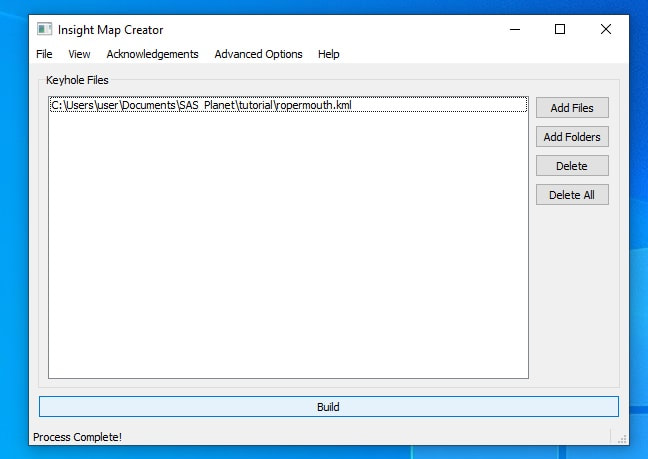
In this case ,there are no advanced options to worry about.
Build.
Insight Map Creator (IMC)
This is the program that is going to create the zoomable levels for you and output it in a format for your chart plotter
When you use IMC's "Views" it will give you different options in the "advanced options"
We will use views> processing modes "keyhole & raster" to create our final product.
On the Jpeg & KML we created on previous page we are now going to perform some keyhole surgery
and make another referencing file needed for later rasterization.
Simple step, get to keyhole mode window via view> processing mode and add the the KML you just created (with SASPlanet) from your folder.
In this case ,there are no advanced options to worry about.
Build.
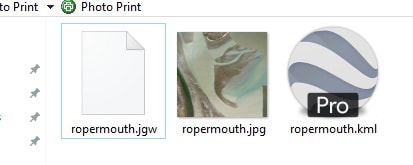
It will drop a .jgw file next to your .kml in same folder.
Keyhole mode finished.
Keyhole mode finished.
Now get back into Views & pick Raster processing mode.
What we want to achieve here is tol turn your single level 19z image into multi zoom levels like 19,18z,17z
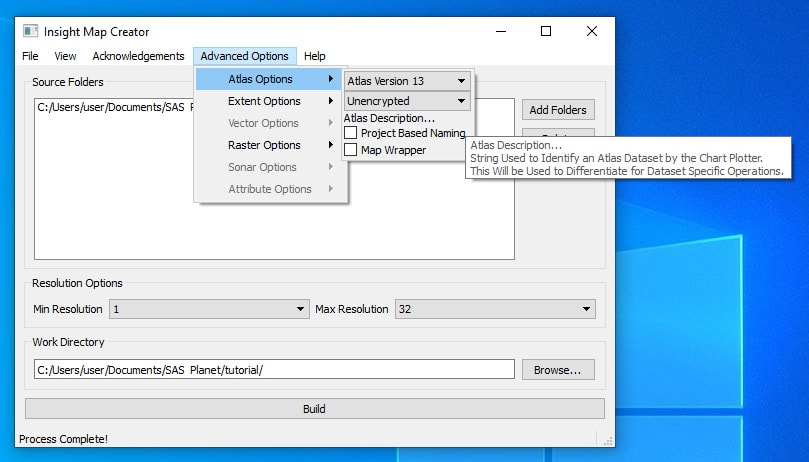
Now the advanced options are available & a few updates are required.
Atlas option , I use 13 for my lowrance devices there is a list here (12 also works for me)
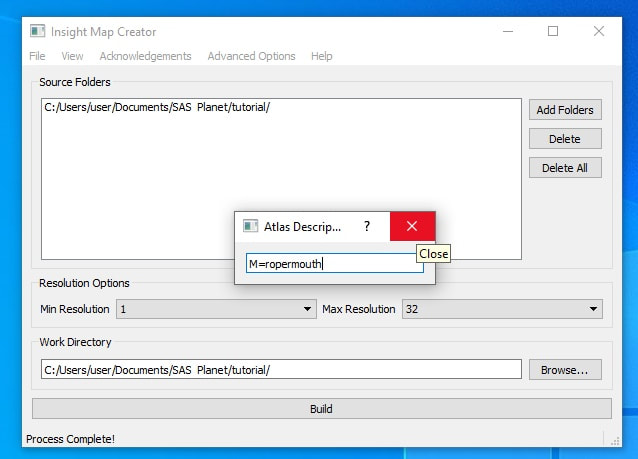
For naming I go M= (M for Map) so in this case M=ropermouth , I might try a Q sometime and see if it works
What this does is creates maps on your sd card, so in the past you might get options on lowrance chartplotter screen for just Navionics & Lowrance (if you had 2 card slots), once your add these atlas names to your card you will get those atlas name options also so it looks like you have 3-6 sd cards in your chartplotter. So you will see titles
lowrance, navionics, ropermouth, Tinaroo Dam, Daly River, Great Lakes etc and that's how you swap between created maps.
What we want to achieve here is tol turn your single level 19z image into multi zoom levels like 19,18z,17z
Now the advanced options are available & a few updates are required.
Atlas option , I use 13 for my lowrance devices there is a list here (12 also works for me)
For naming I go M= (M for Map) so in this case M=ropermouth , I might try a Q sometime and see if it works
What this does is creates maps on your sd card, so in the past you might get options on lowrance chartplotter screen for just Navionics & Lowrance (if you had 2 card slots), once your add these atlas names to your card you will get those atlas name options also so it looks like you have 3-6 sd cards in your chartplotter. So you will see titles
lowrance, navionics, ropermouth, Tinaroo Dam, Daly River, Great Lakes etc and that's how you swap between created maps.
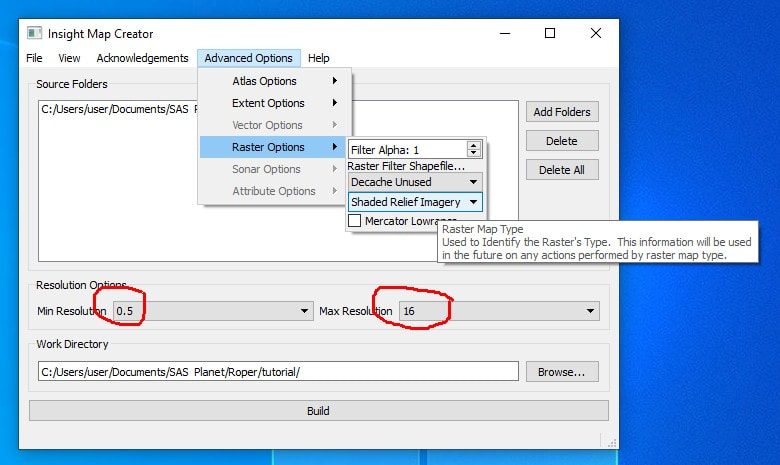
Next ( in advanced options) we need to concentrate on Raster options
Filter Alpha to 1 (this is to stop black borders around your image)
You need to change "satellite imagery" to "shaded relief imagery" ( But its a satellite image isn't it?) Either way you want shaded relief, as in the lowrance plotter there is a "shaded relief" tab that matches & needs checking to make your creation work out on the water. ( And later in your boat you need to modify the shaded relief setting in Lowrance)
Is your source folder correct, we just need the folder your 3 items are in.
What about your output folder, you can use the same folder. BUT remember to change output folder each time as it will overwrite your last lot of newly created AT5 files. (and that has been done alot)
The last highly critical bits are your resolution options and this depends on what image layer you started with.
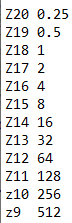
Each resolution is related to a level in SAS Planet , here is a chart. and also in images above.
In this case we started with Level 19z (in SASPlanet) & resolution for 19Z is 0.5 (and its all in binary) so no point putting down a really close up 0.25 (20Z image) as your output will pixilated at that level.
So we will go for its own 19z level resolution of 0.5 and work back.
Maximum resolution will give us outward zoomable options. So 1 would give us a comparable 18z level zoom, 2 a 17Z, resolution 4 a 16Z level etc.
You can put resolution 32 which gives it a comparable 13Z wide zoom and this should give you several layers of zoom in your final output. Reality is, your output may only pick up resolution 0.5,1,2,4 (not creating 8 16 & 32) which may be enough for what you want. Depends on your starting level/layer.
All set, build. This may take a few minutes for the abounded at5 files to be created. The closer to 0.5 & 0.25 the longer processing takes.
Filter Alpha to 1 (this is to stop black borders around your image)
You need to change "satellite imagery" to "shaded relief imagery" ( But its a satellite image isn't it?) Either way you want shaded relief, as in the lowrance plotter there is a "shaded relief" tab that matches & needs checking to make your creation work out on the water. ( And later in your boat you need to modify the shaded relief setting in Lowrance)
Is your source folder correct, we just need the folder your 3 items are in.
What about your output folder, you can use the same folder. BUT remember to change output folder each time as it will overwrite your last lot of newly created AT5 files. (and that has been done alot)
The last highly critical bits are your resolution options and this depends on what image layer you started with.
Each resolution is related to a level in SAS Planet , here is a chart. and also in images above.
In this case we started with Level 19z (in SASPlanet) & resolution for 19Z is 0.5 (and its all in binary) so no point putting down a really close up 0.25 (20Z image) as your output will pixilated at that level.
So we will go for its own 19z level resolution of 0.5 and work back.
Maximum resolution will give us outward zoomable options. So 1 would give us a comparable 18z level zoom, 2 a 17Z, resolution 4 a 16Z level etc.
You can put resolution 32 which gives it a comparable 13Z wide zoom and this should give you several layers of zoom in your final output. Reality is, your output may only pick up resolution 0.5,1,2,4 (not creating 8 16 & 32) which may be enough for what you want. Depends on your starting level/layer.
All set, build. This may take a few minutes for the abounded at5 files to be created. The closer to 0.5 & 0.25 the longer processing takes.
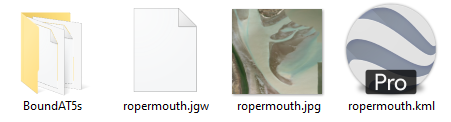
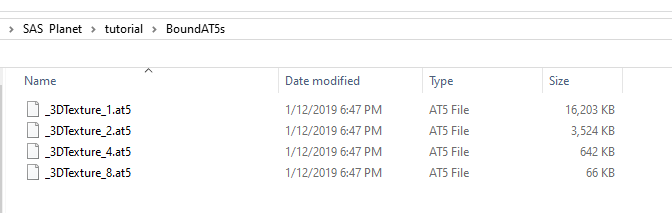
In your folder at completion will be your BoundAT5s folder with your map as at5 files.
Shown below, take note of the naming , each file is a layer 3dtexture_1.at5 is level 1 resolution 3dtexture_2.atf is level2
The bounded at5 folder can be renamed to your selection. In this case Roper Mouth.
Now copy to sd card & test in your chart plotter with correct settings. (Got to find that "shaded relief" setting)
You will need to virtually go to the location (in this case the river mouth GPS settings) to actually see the map unless you can get to location by moving virtually via other mapping charts like navionics & then select "ropermouth" chart.
Your chart plotter reads the maps on loading and searches for atlas names.
So end result worked fine, my map worked & zoomed enough for me.
Normally this would be all over, but I wasn't really happy with outcome. It all worked fine, however the ARCgis map was missing imagery that to me is important in navigating that part
of the world. Love ARCgis, but their editing of coastal areas is harsh & a let down for many river mouths & coastal reefs I have investigated. SO I looked at other options to get the most up to date mapping possible. Sandbars can move throughout the year, Navionics card is out by many KM's in this map & after being marooned
on this particular bar on afternoon/evening for 5 hours I want something better.
Enter the Sentinal Satellite Viewer site. The latest Imagery every 5 days or so. On this site I can locate a low tide & see the sandbars. And I noticed there has been a drastic change in many creek mouths on the map. But how do you get it into a at5 format? You need to be handy with photoshop/corel. You need a masters degree in patience & copy the sentinal jpeg onto your SASplanet jpeg in the best fitting resized & aligned way that you can. Remembering that if you are out by a few pixels it can mean many metres difference in the water.
In my case, the 19Z was too zoomed in, so I went for 17Z to get a much bigger picture of the area, followed the same process & got my jpeg & kml file.
This also helped with the sentinal layers as the sentinal mapping isnt as good when you get down to the 18 & 19Z resolutions. You still end up with slightly blurry
overlay on your original sas kmz jpeg, but its OK.
I ended up with a dozen plus attempts of sentinal downloads once I had found the better resolution at about 450 dpi and smaller closer grabs.
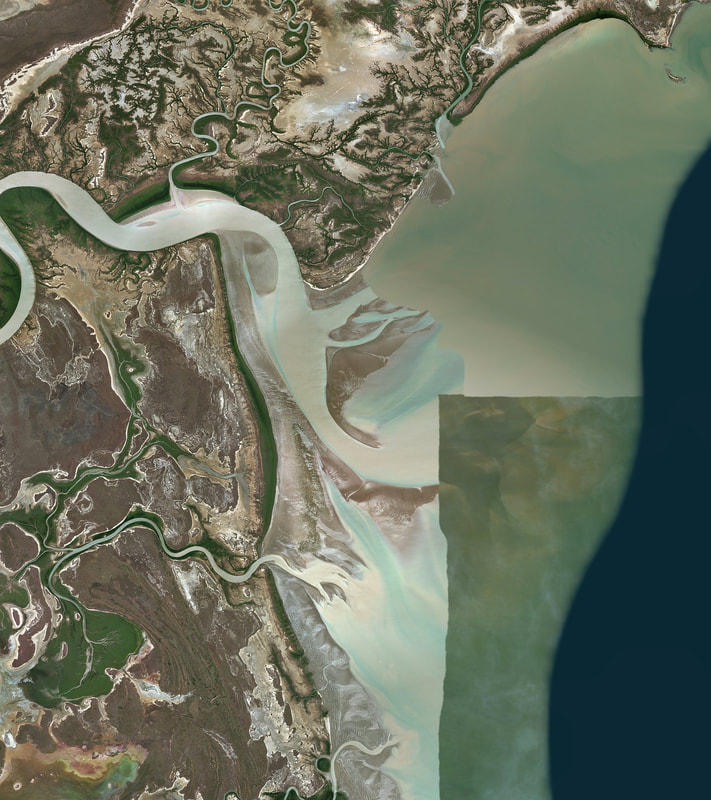
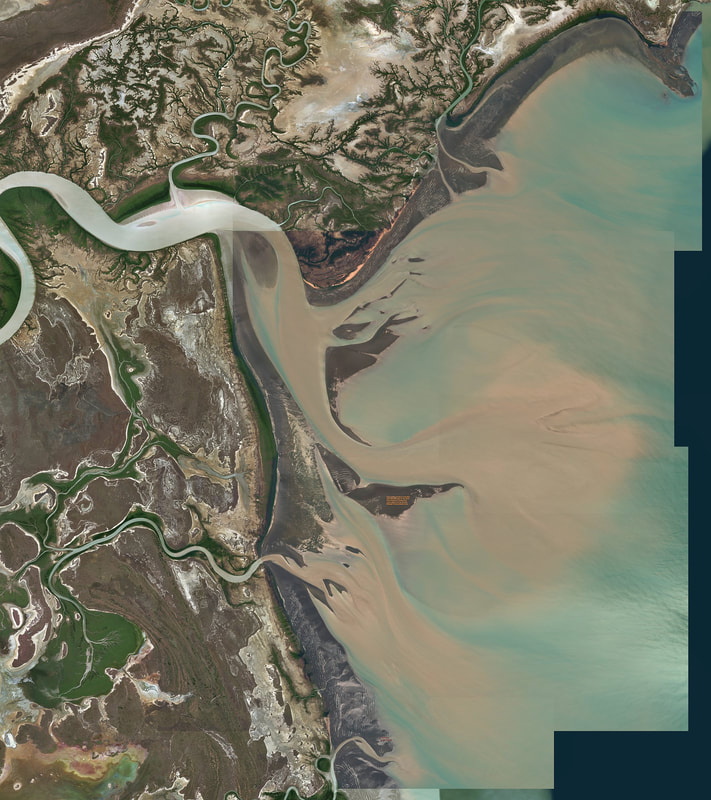
My image ended up with 4 layers from 4 images & resizing each one to overlay was a nightmare. Hence the degree in patience. I'm not going into the photoshop methods.
You can see my original image & the flattened overlays. Some layers were slightly tilted/stretched to fit. Why? Because the two satellite images are not from the same location/ orientation.
And with curvature of the earth etc etc there are too many variations to simply throw a layer down and expect it to align perfectly.
Untested I fear it may be 10's of metres out, but will give a fairly close path to look for if out on the water at night with no moon or beacons to guide you. In this river its just you and the crocodiles.
Previously our only tracks on GPS were that laid on a high tide over sandbars that are now 8km long with average depth of 400mm for a few more kms either side.
The original SASPlanet JPEG tile was not modified in size, so the final photoshop output still matched the KMZ sizes perfectly for the next lot of processing with Insight Map Creator.
This was written to mainly remind me how I did it. There are probably many other ways to do the same thing.
My next "chat" will be on stitching many tiled maps together to make a really large picture greater than the 10K X 10K pixel restriction.
There are only a few great laid out tutorials on what you have just read. Maybe step by step works better for you.
https://twoatsea.com/wp-content/uploads/2018/08/at5-chart-creation-stitch-method-sas-planet.pdf
Youtube Links twoatsea.com ( Rich has a few alternatives ) , alex (Alex has several versions on his channel that will help)
